
When doing your HubSpot Health Check, you’ll get a clear overview of your data quality, a breakdown of issues like duplicates, missing or inconsistent fields, and practical, actionable recommendations to clean, standardize and improve your CRM performance.
How can I request my HubSpot Health Check and what does it provide?
thalox can give you a lot of insights into your HubSpot contact database.
Upon request, you can have access to a free HubSpot data audit, and understand more about the fields that are contributing to your model.
If you don't have a thalox account, visit our free HubSpot Health Check page to learn more. If you're already a thalox customer, follow the steps below to request your data audit.
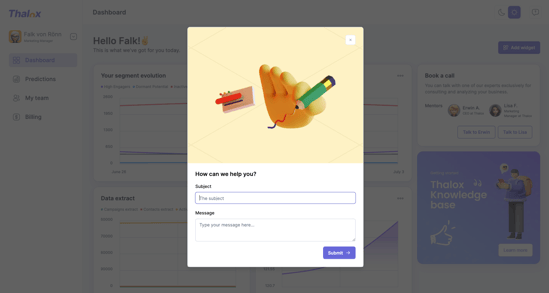
1) To request the data audit, click the question mark icon in the top right corner.

2) A pop-up will appear asking for more information about your support request. Enter "HubSpot Audit Request" as the title, and feel free to include any additional details or expectations for the analysis.
3) Provide Partner access to your instance for one of our experts.
4) Send a screenshot of the results in the Profiler tab. This tool provides information about the properties that contribute to your model and prediction results, highlighting what influences the thalox Engagement Score.
You'll be able to analyze:
- The fill rate of your contact properties
- Duplicate properties for cleaner data management
- Variance percentages of properties to normalize your data
- Tailored recommendations to optimize your data health
5) Receive your HubSpot health check, with all insights and recommendations to improve your data quality and portal organization within 2 weeks.
It is very interesting to see your numbers over time. The main goal is that the number of contacts without e-mail activity is decreasing and the average engagement by contact is increasing.
| Note: Those fields could change when doing a new prediction since thalox is learning from the past and is always recalculating based on your previous campaigns. |
Updated January 2026