
The Thalox Profiler empowers you to visualize your data with remarkable ease and precision, allowing you to gain insightful and comprehensive views of your properties. This tool is a feature inside your Thalox Suite portal. It is designed to simplify the data analysis process, making it accessible even to those who may not have extensive technical expertise.
How can Thalox Profiler help you get your data right?
By providing intuitive visual representations, the Thalox Profiler helps you to quickly identify anomalies within your data, facilitating more informed decision-making and strategic planning.
Whether you are managing large volumes of information or focusing on specific data points, the Thalox Profiler ensures that you can navigate your data landscape with confidence and clarity.
Each time you run a new prediction, the data in the Thalox Profiler is automatically updated.
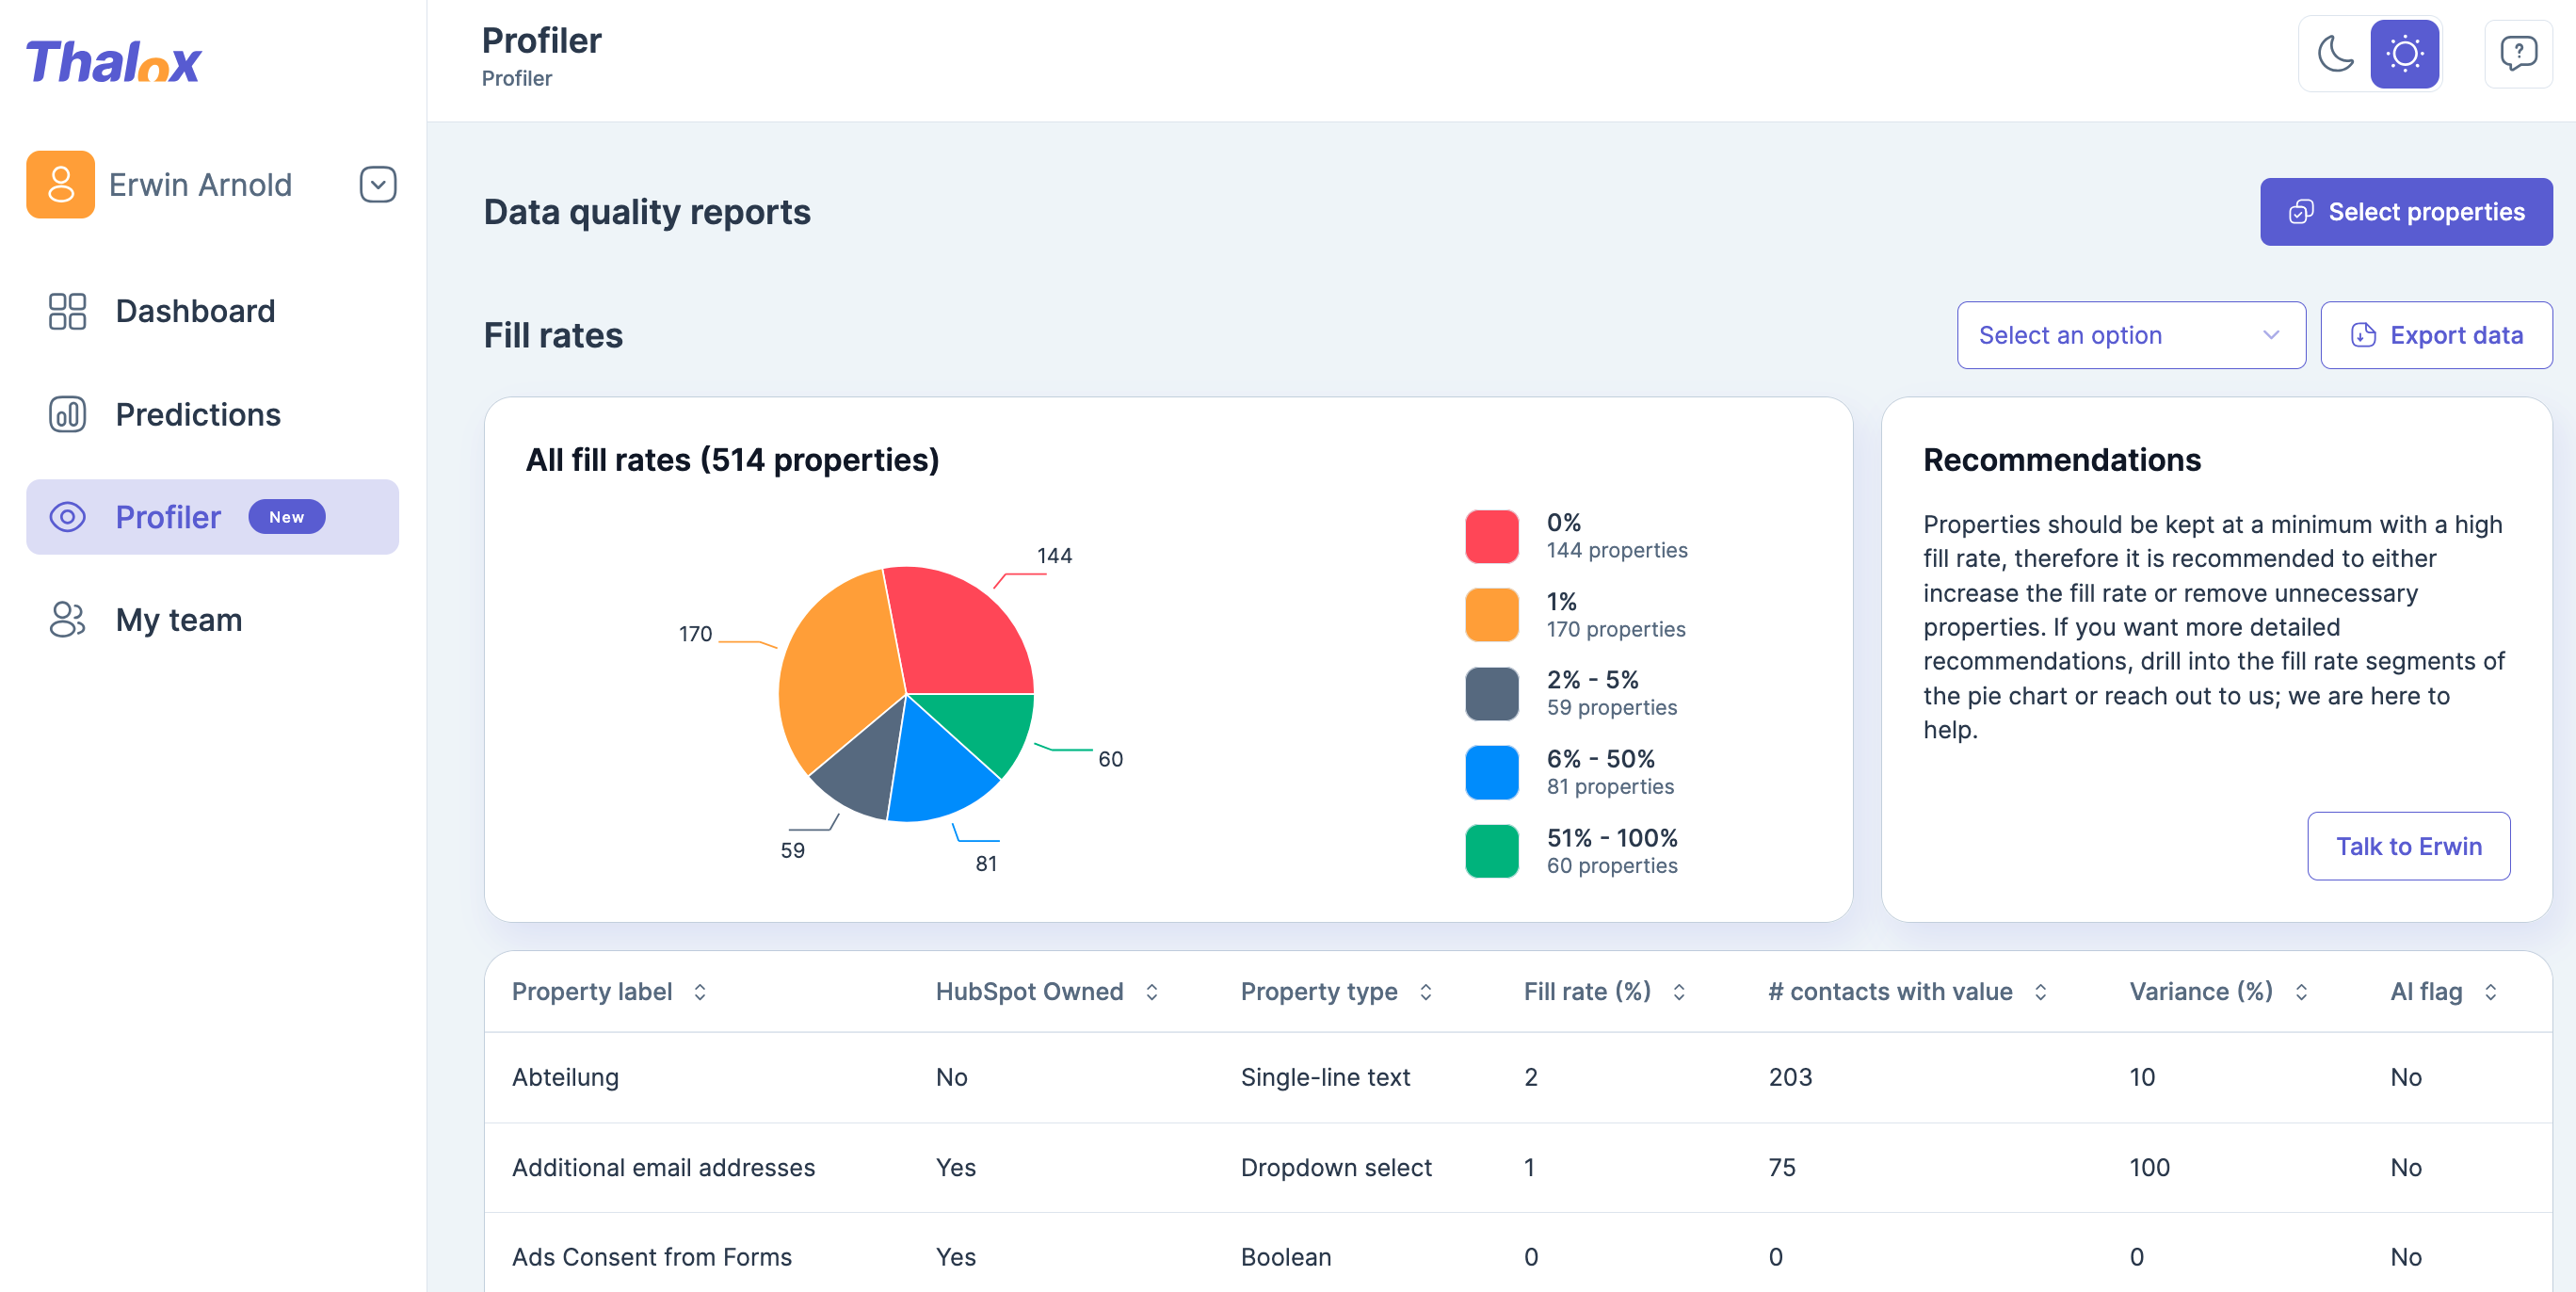
What you see in the "Data Quality Report" is a summary of your HubSpot data field and the corresponding fill rates.
In our example above you have the following distribution:

On the right-hand side, you will see your individual recommendation on how to deal with those fields. We always recommend cleaning and consolidating your data to make segmentation much easier.
Above the recommendation you could choose which fields you want to see. By default, we are showing always all fields.
There are two choices:
- Standard Fields (those fields were created with the first initial setup of your HubSpot instance)
- Custom Fields (those fields were created either by your admin or integration)
- Marketing relevant properties (a preset of fields we created by clicking “Manage Lists”)

When you click "Custom Fields," the pie chart and the list below will dynamically update to reflect only the results pertinent to the selected option. This means that instead of viewing all available data fields, you will now be presented with a focused view that highlights only those fields that have been specifically created by your admin or through integrations.
This tailored display allows you to concentrate on the custom data points that are most relevant to your current analysis, providing a clearer and more streamlined perspective on your data. By narrowing down the information to just the custom fields, you can more easily identify specific needs for adjustments.

In the list view you will see the properties that you have chosen:

You have detailed information about the properties, which are:
- Property Label: Is the display name that was entered in the HubSpot system (not the technical name)
- HubSpot Owned: Indicates if the property is custom or HubSpot standard property
- Property type: Shows the kind of property
- Fill rate: Indicates the fill rate
- # contacts with value: It's the number of contacts that have a value in this field
- Variance: Shows the percentage of variances in this field
- AI flag: Indicates if this field is considered in the algorithm to calculate the Thalox Engagement Score
🚀 Expert Tip: Always think about this before creating a custom property if this is really necessary. In most of the cases, you will find out that those fields are empty or badly filled.
In the Property Value Section you can have a detailed view of the different values stored in a certain property:

On the right-hand corner just select the property you want to inspect. The the export button you can extract those field values.
🚀 Expert Tip: Those exports could be used in a workflow to normalize data such as "Industry", "JobRoles" or "number of employees". We recommend creating dropdown fields for those properties.
The Contact Detail Section shows valuable information about the "Contacts with email address" and "Contacts with first and last name" + the Evolution over time - which is valuable to see the success of your progressive profiling campaigns.

Managing your own lists (presets of field collection)

By clicking the “Manage lists” button as shown above, you can create your own presets of fields which you want to analyse.
If the lists are already available they will be shown in the next screen:

To edit an existing one simpy go to the three dots and choose “open”:

It will show you the fields which are included in the selected list (e.g.):

To add another field just select the field and save your changes by clicking “Apply changes” on the right-hand corner.
If you want to create a brand new list click “Create new”.
🚀 Expert Tip: We recommend to create lists for the different enteties like contact, companys and deals to simply organize your data health framework
Updated January 2026

